Event Statistics
Events statistics module a feature that allows you to track and analyze user actions, or "events," within your app or website. This can help you gain insights into how your users are interacting with your product, and identify areas for improvement. With the events module, you can track a wide range of events, including user actions, system events, and custom events. You can then use this data to create reports and visualize your data in a variety of ways, such as graphs and charts.

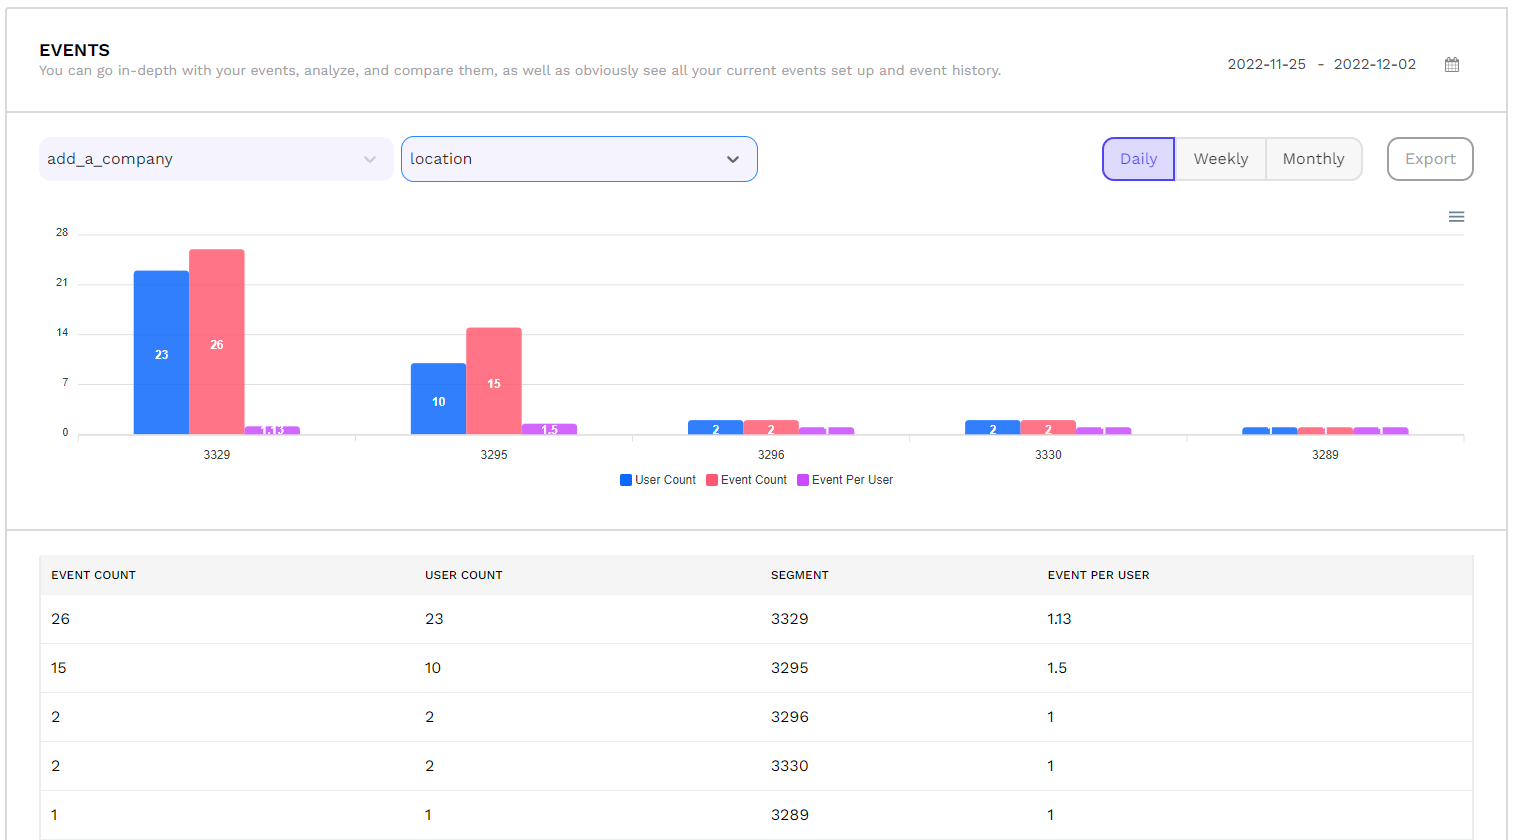
You can see event sum, user count and event per user for the selected events in this page.
Event Sum shows how many times the selected event was triggered,
User Count shows how many unique users triggered that selected events and,
Event per User calculated as the total number of events divided by the number of unique users.

In addition to tracking events, you can also examine how much those parameter categories are triggered by selecting the event parameter for the event you want.

Thus, how many subcategories of an event parameter are triggered can be reported and compared for each category separately. (In this version, top 5 categories are reported. However, this feature can be customized to report any number of parameter categories.)
Let's say you select the add to cart event and the defined product categories event parameter for this event. It is reported that each product category (clothing, accessories, shoes for example) was added to the cart in total and how many individual users added it to the cart.
This report allows you to see how often your event-specific subproperties were triggered and enables you to conduct research on more specific user segments.